14 Oct CASE STUDY: BUSINESS INTELLIGENCE SOLUTION USING MACHINE LEARNING ON GOOGLE CLOUD PLATFORM APPLIED TO THE INDUSTRIAL SECTOR (PART I)
The solution we are going to implement is based on a solution developed by Evenbytes for one of our clients. In the following link you can check the implementation of the final solution.
NOTE: You can see the solution running as well as the summary of the case study in the following link BI Solution based on GCP & Machine Learning
In order to have a global overview of the solution, we are going to describe the customer needs:
Functional requirements
Solution should monitor and extract data about the activity on one of the airport runways. The main objective of this monitoring is to generate a BI report with a series of indicators visualize the performance of the customer business activity.
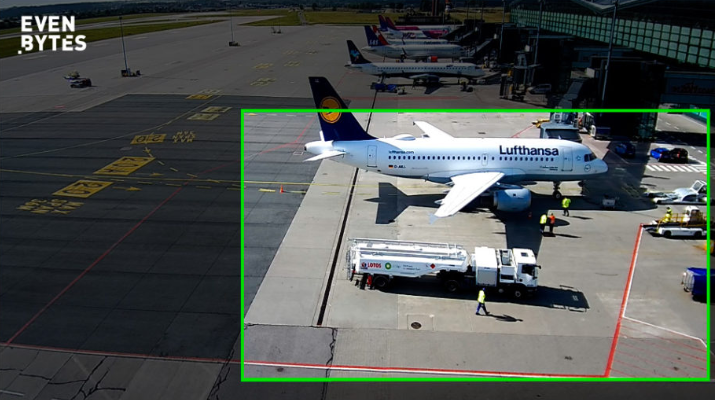
As input data we only have a live camera focus in the parking area of an airport. The solution will monitor only the first gate. The following actions need to be monitored:
- Parked time of the airplanes
- Duration of refuelling
- Luggage loading / unloading time
- Airline Company
- Airplane model
The process is required to be fully automated and without any human intervention.
The monitored data will be exploited in two different ways:
Real-time data monitoring (with a maximum delay of 30 seconds)
Daily report for generation of graphs with statistics
SOLUTION ARCHITECTURE
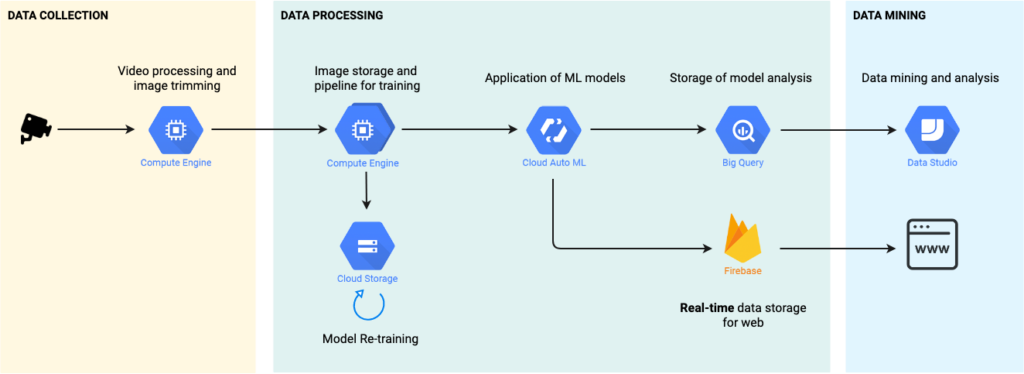
The solution design is based on 3 main blocks / areas, data collection, data processing and data visualization.
Solution Design
In the first block, data collection, we have a video stream accessible through the url http://kamery.airport.gdansk.pl:1935/EPGD/pps3.stream/playlist.m3u8, provided by airport. The camera is recording the 24 hours non stop. From this video source, we have a task to extract a sequence of still images or photos that will be stored in a bucket created in GCP for further processing. (Data source extracted from https://www.airport.gdansk.pl/lotnisko/kamery-internetowe-p30.html)
The second block (data processing), the solution will manage the images stored in the bucket. This process is in charge of the analysis and processing of the images. This analysis of images is based on machine learning models previously trained. The process of image analysis is done thanks to the use of a virtual machine running on GCP. As a result of this process we will obtain a series of labels or metadata that will be stored in BigQuery for further analysis and processing. These same tags are stored in a Firebase database so that they can be consulted in real time by the monitoring Web.
Finally, in the last block (data visualization), users will be able to query the data generated thanks to a BI report created in Datastudio. This dashboard shows the most relevant data and indicators, such as the length of stay of each aircraft, the number of companies in a day, the average number of flights per month … etc. You can check the final result here.